Finding And Fixing Node.js Memory Leaks: A Practical Guide
Fixing memory leaks may not be not the shiniest skill on a CV, but when things go wrong on production, it’s better to be prepared!
After reading this article, you’ll be able to monitor, understand, and debug the memory consumption of a Node.js application.
Kévin Maschtaler
https://marmelab.com/blog/2018/04/03/how-to-track-and-fix-memory-leak-with-nodejs.html
In addition to this very good article , here are a couple of tipps how to enable remote debugging.
node –inspect=192.168.178.133:9229 yourapp.js
This will bind the debugger to a different IP address:port. Otherwise only LOCALHOST will be available
If you are using PM2
pm2 start –node-args=”–inspect=192.168.178.133:9229″ yourapp.js
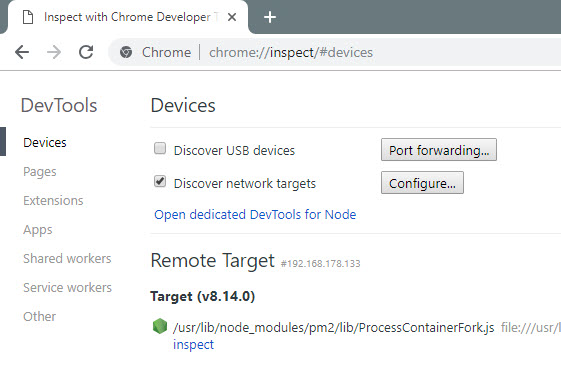
Then open Chrome browser and navigate to chrome://inspect
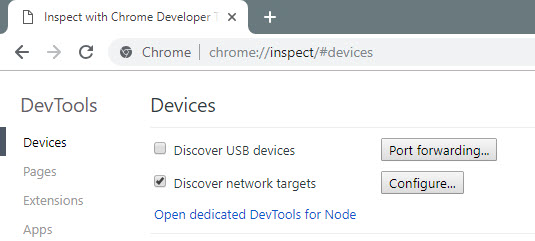
Check “Discover network targets” and click “Configure”
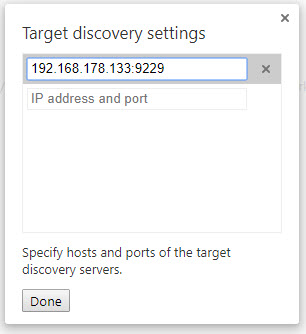
Your application is ready for inspect