Charts and Graphs and Reports and Such
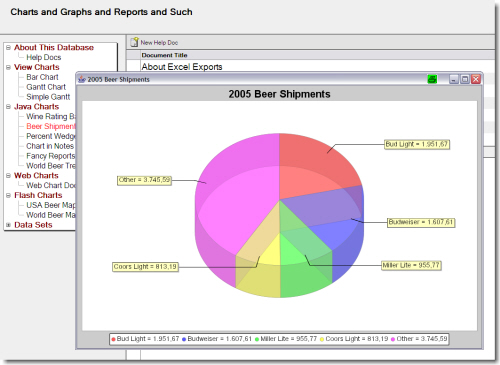
This is the database used by Rob McDonagh and Julian Robichaux in their Lotusphere 2008 session BP210: Reports, Charts, and Graphs in IBM Lotus Notes.

This is the database used by Rob McDonagh and Julian Robichaux in their Lotusphere 2008 session BP210: Reports, Charts, and Graphs in IBM Lotus Notes.

Richard Hogan of 6wSystems released ddCharts v5.0 – Beta 1(b) which displays the charts also in a Notes client, and as, it doesn’t need to access the server using http, it solves the double login issue. Performance with very large views has also been improved.
If you are looking for a solution to display your data as a pie-, line- or bar-chart ( or as gauge as well ) then download your free evaluation copy of ddCharts now.

There will be another download available on the 6wSystems website in a few days which let you create charts from !!HELP!!.
!!HELP!! is an open source trouble ticket solution for Lotus Notes / Domino. Visit OpenNTF.org to get your copy of !!HELP!!.