It’s time for ILUG2007

Bags are packed, ready to go. In about 24 hours I’ll start my trip to Dublin, Ireland. I’ll arrive on wednesday moring at 11 am and will stay at the Dublin City Hotel , Dame Street. Looking forward to seeing you all at the conference. In advance, thanks to all organizers for making this event possible.

ILUG2007


Was passiert wenn …

ein Richter beschlieÃ?t, daÃ? zukünftig keine Mais mehr gelöscht werden dürfen, beschreibt Chris Byrne in seinem Blog

Jetzt erkläre mir bitte einmal in diesem Zusammenhang, welchen Sinn es macht, eine wegen GröÃ?enbeschränkung nicht zustellbare Mail incl. aller Anhänge an den Absender zurückzuschicken.


Which color is suitable for which purpose?

color in motionColors reflect a certain personality. They also have several meanings, most of which are closely connected to each other.
For example, blue stands for sky, heaven and water. It reflects freedom and peace, but it can also mean cold, protective, authoritative or technical.
Red is the color of blood, it reflects courage, romance, but it also means hot, dynamic, vital, commanding or alert. All these symbolic connotations are perfectly visualized by Claudia Cortes in her Color in Motion, a real treat for the eye


Change Domino’s DOCTYPE

Maybe everybody already knows … except me.
You can change the doctype ( from at least version 6.5.3 on ) by setting the DominoCompleteDoctype environment variable in notes.ini. It has 3 different values:

0 = <DOCTYPE HTML PUBLIC “-//W3C//DTD HTML 4.01 Transitional//EN”\\>
1 = <!DOCTYPE HTML PUBLIC “-//W3C//DTD HTML 4.01 Transitional//EN” “http://www.w3.org/TR/html4/loose.dtd”>
2 = <!DOCTYPE HTML PUBLIC “-//W3C//DTD HTML 4.01//EN” “http://www.w3.org/TR/html4/strict.dtd”>

So far, so good. But what, if you want to have

<!DOCTYPE html PUBLIC “-//W3C//DTD XHTML 1.0 Transitional//EN” “http://www.w3.org/TR/xhtml1/DTD/xhtml1-transitional.dtd”> ??

As of Domino 7.0.2 there is a new field that allows you to set the doctype on a form basis. Just add a computed for display field called $$HTMLFrontMatter.


Charting In Microsoft Excel

I was searching for informations on how to create charts in Microsoft Excel and found Jon Peltier’s page. A great resource, that I would like to share with you!

Over the years I have learned a great deal about making charts in Microsoft Excel, and I have amassed a large collection of techniques for creating and formatting special charts. This is a categorized collection of my knowledge.

I’ve sorted the charts into the following topics. Many of the examples here fit into multiple topics.

{ Link }


atnotes.de – Treffen, 28. – 29.04.2007 in Kulmbach

Banner atnotes.de Nach mehreren Treffen der Moderatoren und interessierter Mitglieder des deutschen Notes Forums atnotes.de in Kassel, findet am 28. und 29. April in “Deutschlands heimlicher Bierhauptstadt” Kulmbach ein weiteres Treffen statt. Traditionsgemäss wollen wir bewusst keine Veranstaltung bieten mit Präsentationen oder Fachvorträgen, sondern das persönliche Gespräch oder überhaupt erst das Kennenlernen der Personen hinter den Forumsnamen fördern.

Erfahrungsgemäss bieten sich hierbei hervorragende Möglichkeiten, den eigenen Horizont zu erweitern, neue Kontakte zu knüpfen und das eigene “Netzwerk” zu erweitern. Und interessant, lustig und entspannt ging es bisher auch immer zu! Gefachsimpelt wird natürlich auch 😉 Und das weit über das Treffen hinaus!

{ Mehr zum Thema }


Display Statistics for !!HELP!! On The Web

Last week I got a phone call from Richard Hogan of 6w Systems. Richard asked if I would like to add functionality to !!HELP!! to create charts, graphs or even dashboards. Hence I receive a lot of questions about the statistics in !HELP!!, I was glad to hear that 6w Systems offer an easy to use solution to achieve the aim.

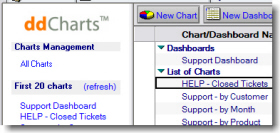
ddCharts - Create Charts For !!HELP!!

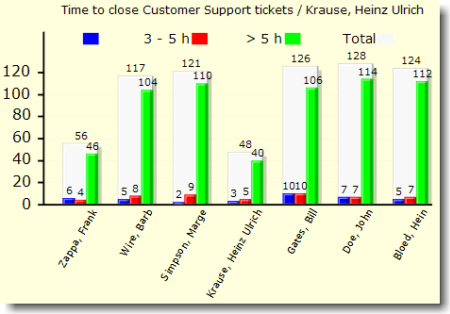
ddCharts, which is 100% Notes, allows Notes developers & administrators to easily, and quickly, create drill down charts / graphs / dashboards of live Notes data. There is no data export and charts always display the latest data. You can click on a chart to drill down, and even into Notes documents (if enabled).

ddcharts It can be used as a standalone db, or one can use the DDchart object with Lotusscript to create one’s own charts.
To allow ddCharts to chart the information in !!Help!! would only require the creation of one or two views for the !!HELP!! db, and then creating the chart definition documents (these are simply Notes documents in a ddCharts db, and they store the name of the data db, name of view, and chart settings, etc).

ddCharts is neither Open Source nor it is free of charge but a (single server-) license is available at a very fair rate.


Composite Applications Blog

Bring information and collaboration into the context of your daily business processes using composite applications
This web log is a joint effort by the key technical architects and user experience professionals to open a direct line of communication with developers about the capabilities of user facing composite applications. The primary focus will be on Lotus Notes/Domino, WebSphere Portal, Lotus Expeditor, and future Lotus products to be named later. We will also be commenting on composite application trends that we see in the broader market.


Vor Oder Zurück?

Sommerzeit - Winterzeit“Same procedure as every year”. Es ist mal wieder soweit. In der Nacht zum Sonntag werden die Uhren auf Sommerzeit umgestellt.
Aber wird die Uhr nun eine Stunde vorgestellt, oder schenkt man uns eine Stunde Schlaf zusätzlich dadurch, daÃ? die Uhrzeit quasi “eingefroren” wird und es in der Nacht gleich 2 x 2:00 Uhr schlägt?

Alljährlich stellen sich diese Frage unzählige Mitmenschen. Die verzweifelten Versuche, auf die Frage nach dem Vor oder Zurück eine Antwort zusammen zu stümpern, kann man dann all abendlich in den Nachrichten belächeln. Dabei ist die Antwort eigentlich ganz einfach , und mit der passenden Eselsbrücke weiss man auch nächstes mal wieder Bescheid, ohne erst bei GOOGLE nachzuschlagen.

  • Zur Sommerzeit werden die Gartenmöbel vor das Haus gestellt.
  • Zur Winterzeit werden die Möbel wieder zurück ins Haus geholt.

Also, am Sonntag die Uhren eine Stunde vorstellen! 🙂


jXLS – Excel Reports from XLS templates

A common requirement for many reporting applications is to provide the ability to export reports to Microsoft Excel format. This can be challenging for a number of reasons, including:

  • Most reporting engines require the use of a report design tool to develop reports.
  • Reports designed to be exported to PDF or HTML do not always translate well to XLS format.
  • Advanced Excel functionality such as complex forumlas, macros, and charts are not always available through the reporting engines.
jXLS - Excel Reports from XLS templates

jXLS is an open source Java library that greatly simplies this process by providing the ability to use XLS templates as the basis for generating reports in Excel format.
You only need a few lines of code to generate the output … And ( this my favourite ), you do not need to have MS Excel installed on the machine running the code.


public class JavaAgent extends AgentBase {

public void NotesMain() {
try {

Session session = getSession();
AgentContext agentContext = session.getAgentContext();

List staff = new ArrayList();
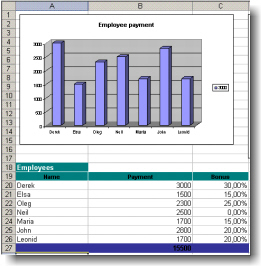
staff.add(new Employee("Derek", 35, 3000, 0.30));
staff.add(new Employee("Elsa", 28, 1500, 0.15));
staff.add(new Employee("Oleg", 32, 2300, 0.25));
staff.add(new Employee("Neil", 34, 2500, 0.00));
staff.add(new Employee("Maria", 34, 1700, 0.15));
staff.add(new Employee("John", 35, 2800, 0.20));
staff.add(new Employee("Leonid", 29, 1700, 0.20));
Map beans = new HashMap();
beans.put("employee", staff);
XLSTransformer transformer = new XLSTransformer();
transformer.transformXLS("c:\\in.xls", beans, "c:\\out.xls");

} catch (Exception ex) {
ex.printStackTrace();
}
}
}