Gantt Charts in Notes Views – The Sequel
Several gurus of the Lotus Notes community ( like Chris Blatnick, Nathan Freeman, Theo Heselmans, Vitor Pereira, and to round it out Kevin Pettitt ) are working on Gantt Charts in Notes Views these days. Nathan Freeman also provided a sample database.
I’ve downloaded the sample and gave it a try. The first thing I found out is that it is not possible to display more than one month in a view because the “zeroDate” – value for the columns is calculated by stripping the last part of the view title and convert it into a DateTime value. The sideeffect of this method is that documents from a different month are displayed in the view but no chart is displayed for these documents.
OK, you can avoid this by setting the view selction formula properly. The second thing is that Nathan uses
zeroDate :=@TextToTime(@Right(@ViewTitle; "-"));
in each of the 62 view columns to calculate the date basis. Maybe a bit ressource performance consuming, isn’t it ?
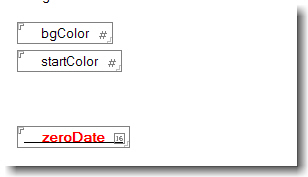
So I decided to make a few modifications to address these issues. I created a new field in the task form ( “zeroDate”, Date/Time, calculated )

and assigned the following formula to the field:
@TextToTime("[01/"+ @Text(@Month(startDate)) +"/"+ @Text(@Year(startDate)) + "]" )
When you create a new task, the zeroDate field is now set to the first day of the month according to the start date’s month.
You can now delete the unnecessary code from the column formulas and reduce it to
col := 0;
colDate := @Adjust(zeroDate; 0; 0; col; 0; 0; 0);
@If(@Date(startDate) = @Date(coldate); duration; " ")
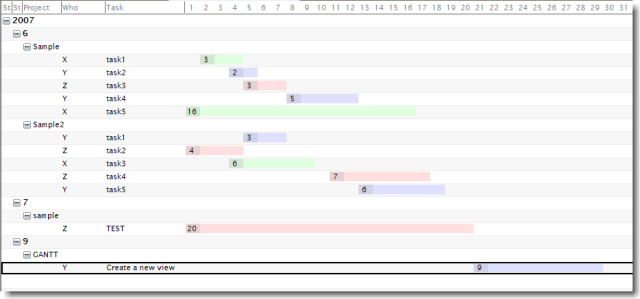
After adding two categorized columns ( one contains @Year(StartDate) and the other one @Month(StartDate) ) the view displays the charts for each month in a seperate category.

The view can have any name of your choice.